 When I wrote Manage It! Your Guide to Modern, Pragmatic Project Management, I included this chart, the Iterations Content Chart as part of a possible dashboard. I created that chart to clarify the challenges a specific team faced. They had problems with multitasking and the inevitable changes.
The first way to use an iteration contents chart is to gather data and answer questions. That's what the original team did.
The Story of the Original Team's Contents Chart
In each of the first two iterations, the team finished 6 stories. However, notice that yellow story. That was a change. The product leader had changed out one story and added that new story in.
The effects of that change and addition started to show up in the third iteration. Notice the red defects, and more yellow changes—and fewer finished features.
Things got worse.
By the 9th iteration, the team only completed 2 stories, plus 2 additions, plus fixing 4 defects.
That's when the project manager stepped in and said, “No more changes. We either plan for an iteration or we don't. But we can't keep changing what we do.”
After much loud discussion, the product leader agreed. The team still had to fix a problem in the following iteration. However, once the product leader stopped changing the work, the team was back to their normal throughput of roughly 6 stories per iteration. (A back-of-the-napkin cycle time of 2-3 days each.)
However, since the iteration contents chart can help the team see aggregate data, I've used it in two other ways since. One was help a different team see their multitasking data.
See Multitasking Data
 Team 2 was attempting to work on two projects “at the same time.” Yes, multitasking.
Since they worked on two projects at a time, they tried to finish three stories each iteration for each project. Those are the lighter blue and the darker blue bars.
However, by the time they got to the second iteration, they couldn't complete 3 stories for each project. They could only finish two stories. That's because each project had a defect the team needed to fix. Two stories for each project plus one defect per two projects equals a total of 6 things. That's a reasonable throughput, right?
No.
A reasonable throughput does not include additional defects from the work the team thought they completed.
The third iteration was much worse, with just one story per each project and 4 defects per project. How did they have more defects than previously “finished” features? Because the team injected more problems with all their interruptions.
There is no limit to the number of errors a person or team can create when they are multitasking. No limit.
They changed their approach, starting in Iteration 4. Instead of adding more Project 2 features, they only added more Project 1 features and finished more defects (the red and yellow bars).
This is one of the effects of multitasking: unexpected defects “appear” because we're distracted. Then, the aging increases, the WIP goes up, and the throughput goes down. (See the flow metrics newsletter.)
Some teams think they can use the iteration content chart to see cycle time. I used to think so, too. But I was wrong. That's the caution.
Caution for Cycle Time
Review the iteration contents charts again. They look as if they could offer a back-of-the-napkin approach to measuring cycle time. Maybe they can for features, but definitely not for defects. And that's a huge, huge risk for predicting anything about future progress.
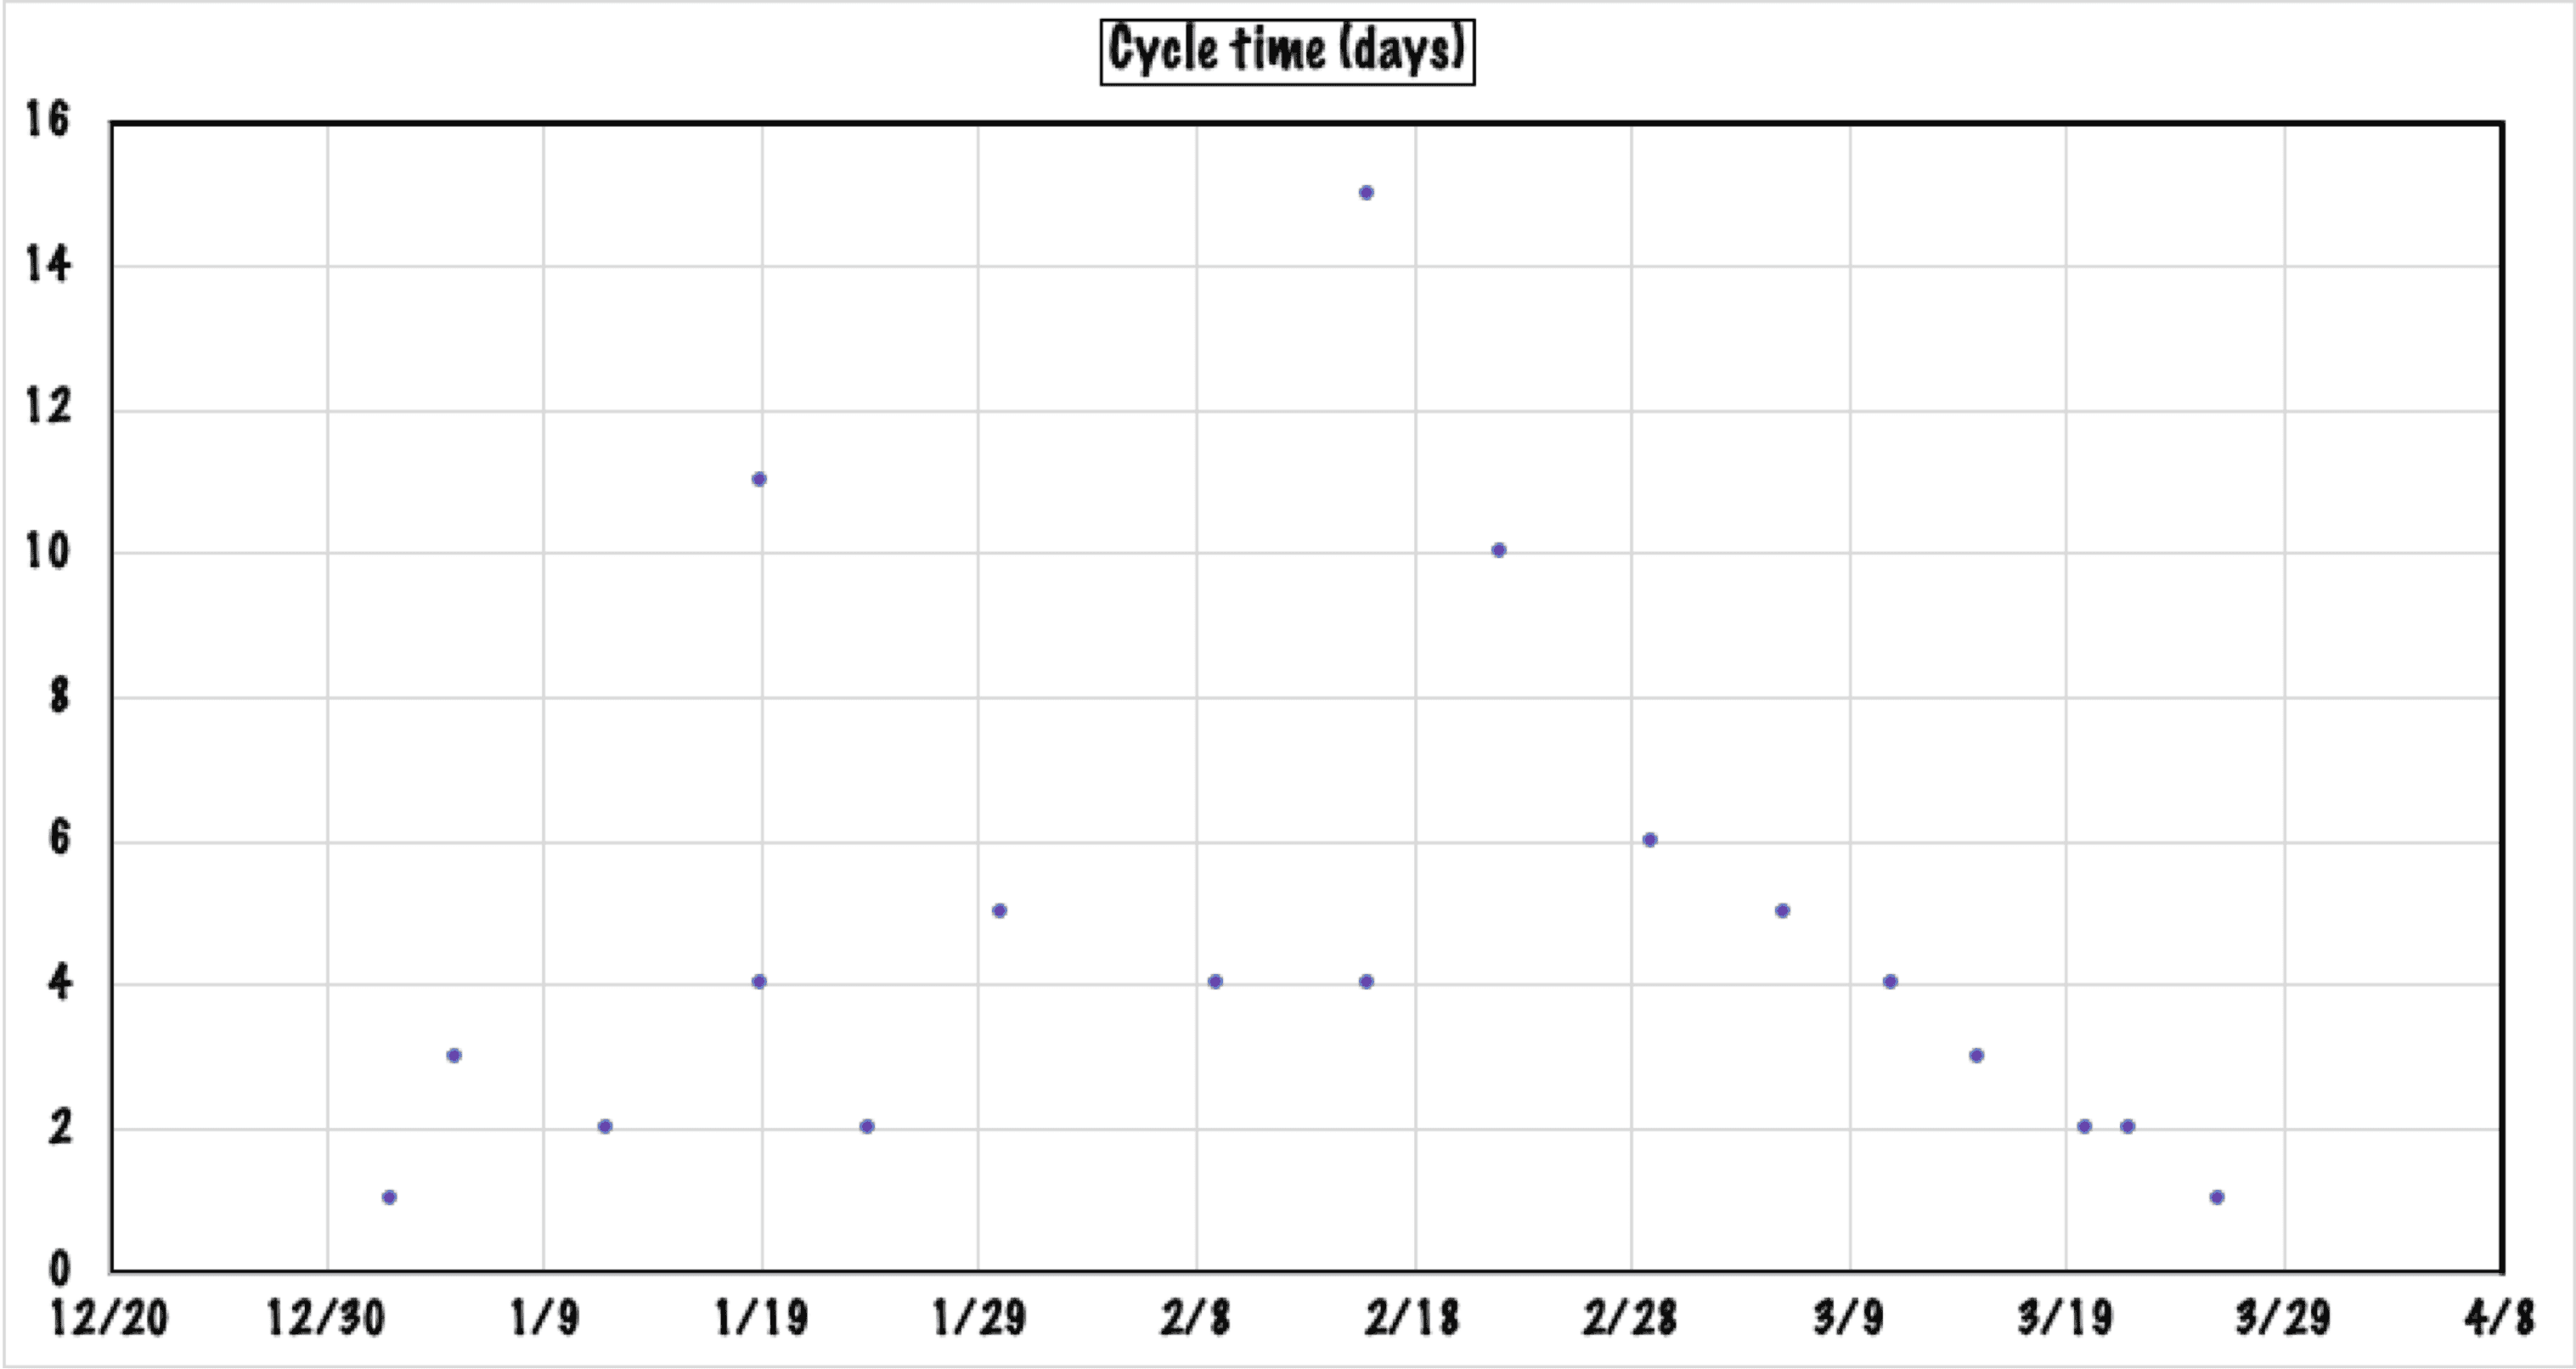 This cycle time series is from How to Move from Story Points and Magical Thinking to Cycle Time for Decisions. (I realize those dots are difficult to see. You can click on the image to see it in a new tab.)
While that team had cycle times that look as if they are similar to these teams, note the larger cycle times for some of the stories. That's exactly the problem these teams had with their changes and defects. It was even worse for Team 2.
While they stopped multitasking on two projects, they had to continue fixing defects, the red and yellow bars. How old were some of those problems? Many more of those defects took much longer than the regular stories to finish.
Some of their defect cycle times were over 20 days. Many were over 14 days. All because of the multitasking. Multitasking makes everything unpredictable and worse.
Iteration Contents Charts Can Help Prompt Thinking
An iteration contents chart can help a team see immediate progress (or lack thereof). However, it does not show the aging or the overall cycle time. So you cannot use it for prediction. However, if your team is wedded to their iterations, the iterations content chart can help you start to reason about your situation. The chart prompts the team to gather data and ask questions. That makes it useful.